
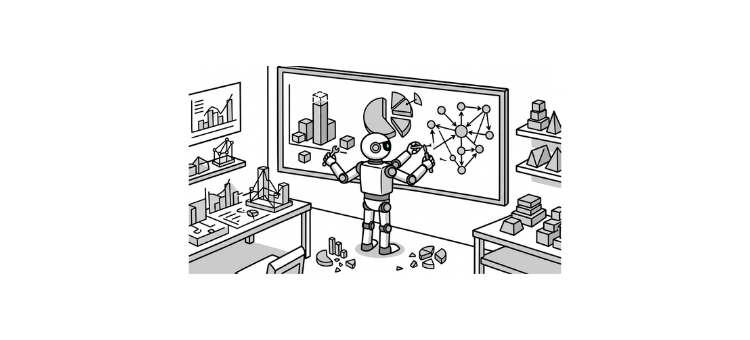
Anthropic announced on March 12, 2026, that Claude can now generate interactive charts, diagrams, and data visualizations directly inside a conversation. Previously, users who needed a visual had to describe what they wanted and then rebuild it themselves in a separate tool. That step is gone.
What Claude Can Now Build Inline
Claude can produce bar charts, line graphs, flowcharts, system architecture diagrams, SVG graphics, and functional React components (small interactive UI pieces) — all without leaving the chat. You don’t have to ask explicitly. Claude decides when a visual will help and renders one automatically, though you can also prompt it directly with something like “draw this as a diagram” or “visualize how this changes over time.” Crucially, the visuals evolve as the conversation continues. Change a variable, add a data point, ask a follow-up — the chart updates.
This is different from Claude’s existing Artifacts feature, which generates longer outputs like documents and full apps in a fixed side panel. These new inline visuals are meant to be fluid and conversational, not static deliverables. Anthropic was also clear that this is not image generation — Claude is rendering structured visual elements from code, not producing photos or illustrations from a text prompt.
Who Can Use It and When
The feature is available to all Claude users now, in beta. Anthropic did not announce changes to pricing tiers alongside this release. The update ships just days after OpenAI added interactive visual explanations for math and science concepts to ChatGPT, making this a direct response in an increasingly competitive space for AI tools that go beyond plain text answers.